
Article
A Tale of Two Labs: Same Samples, Different Results
Two labs analyzed the same aluminum samples and reached opposite conclusions about chromium
Blaise Mibeck · Cubic Labs LLC · June 2025
Download PDF All articles and white papers

Widget Manufacturing’s paint problem
Widget Manufacturing Inc. had painted aluminum widgets failing in the field. The paint peeled within months of installation, and the failures coincided with a switch to a cheaper aluminum supplier. Warranty claims were mounting, and the company needed answers quickly.
The paint should have bonded through a chromate conversion coating, which forms a chemical bond between the aluminum and the primer. The original supplier dipped the aluminum in a chromium solution. The new supplier sprayed the treatment. Widget wanted to know whether that change caused the failures, or whether the chromium had migrated into the primer, gone too deep into the aluminum oxide layer, or disappeared. A contaminant in the aluminum or the paint could also have interfered with the treatment.
Act I: Plug-n-Chug Laboratory
Widget first turned to Plug-n-Chug Laboratory, a testing lab known for fast turnaround and competitive pricing. Widget’s engineers sent two aluminum samples: one from the new supplier and a control from the previous supplier, with its paint intact. They asked how much chromium was on the surface of each. The lab’s approach was simple:
- Mount the samples in the SEM chamber.
- Focus on the surface.
- Run standard EDS analysis.
- Generate a report.
The report arrived within 48 hours: “No chromium detected on either sample.” The control sample had to contain chromium, so the result was wrong. Widget paid the invoice and kept looking for answers.
Act II: Problem-Solving Labs Inc. asks questions
Still facing failures, Widget approached Problem-Solving Labs Inc., a research-oriented facility known for difficult analytical problems. The first meeting was different. Before accepting the samples, the team asked questions. Trent, the research manager, and his colleagues asked which aluminum alloy was used, how it was painted, how many layers there were and how thick each was, whether returned parts came from particular climates, how the layers were cured, how the chromium solution was applied and how long before painting, how thick the conversion layer should be, and how the other lab had analyzed the samples. Widget’s engineers answered what they could.

Alice, the lab’s SEM-EDX expert, explained why the first lab missed the chromium. The characteristic x-rays that identify elements come from deep within the sample, especially when the top surface is mostly light elements such as those in paint. The beam is narrow at the surface, but the interaction volume is wide, so a thin chromium layer can be missed. She proposed cross-sectioning the painted samples, mounting them in epoxy, and polishing them. In cross-section, the chromium layer appears thicker to the beam. She also needed the paint side to face the EDX detector so the chromium x-rays had a line of sight to the detector window through the lighter paint layers.
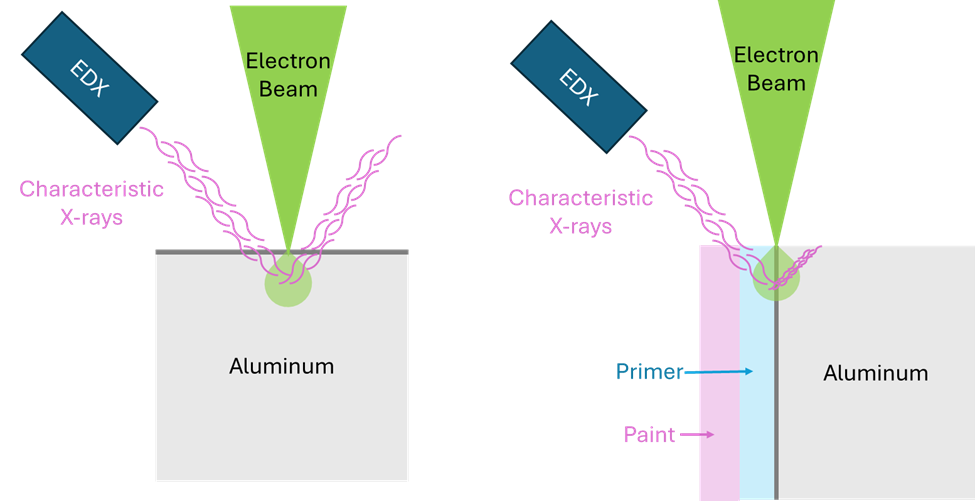
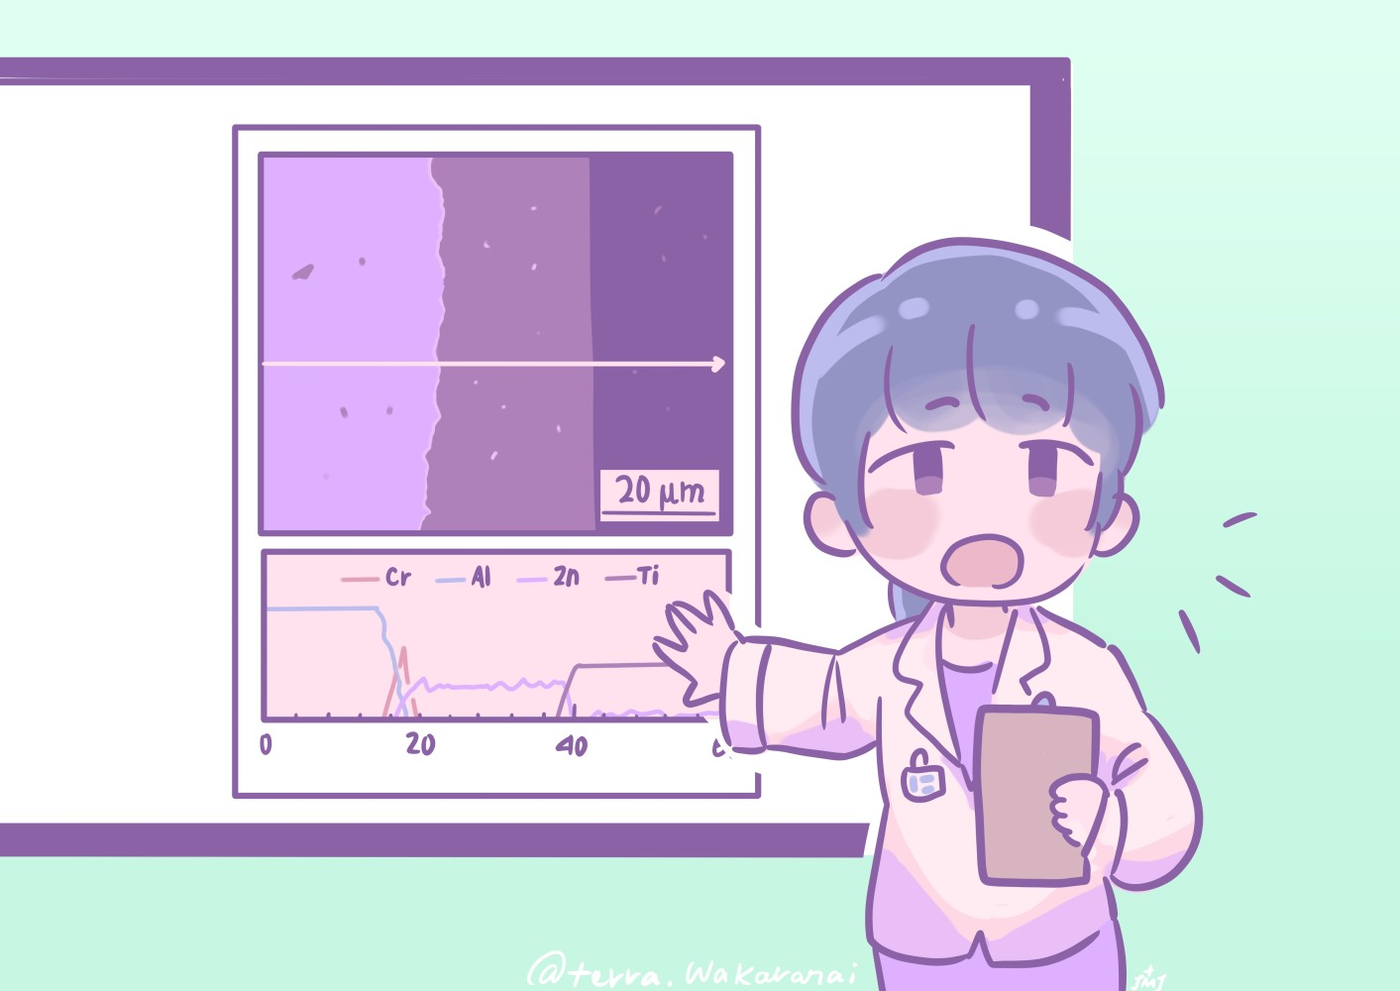
The technicians polished the cross-sections to a mirror finish. Alice collected SEM images, then spot and region spectra of each layer, then line spectra across the layers, with settings optimized for linear resolution. She found chromium in both samples, in the right place. The defective sample had much less chromium on average, and each line scan gave a different amount, so the coating was uneven. The good sample showed consistent thickness and amount in every scan.
Each sample received about 30 line scans, and the interim report included a statistical analysis. Peak fitting estimated the chromium layer thickness. The 50-plus images and element maps collected for each sample showed no contaminants. The report concluded that the only difference was the amount and consistency of chromium in the defective sample.
Act III: How much is there?
Widget’s engineers asked how much chromium, in µg/cm2, was on a particular sample. Trent said the answer needed a bulk method with a low limit of detection and introduced Bob, the lab’s analytical chemistry expert.
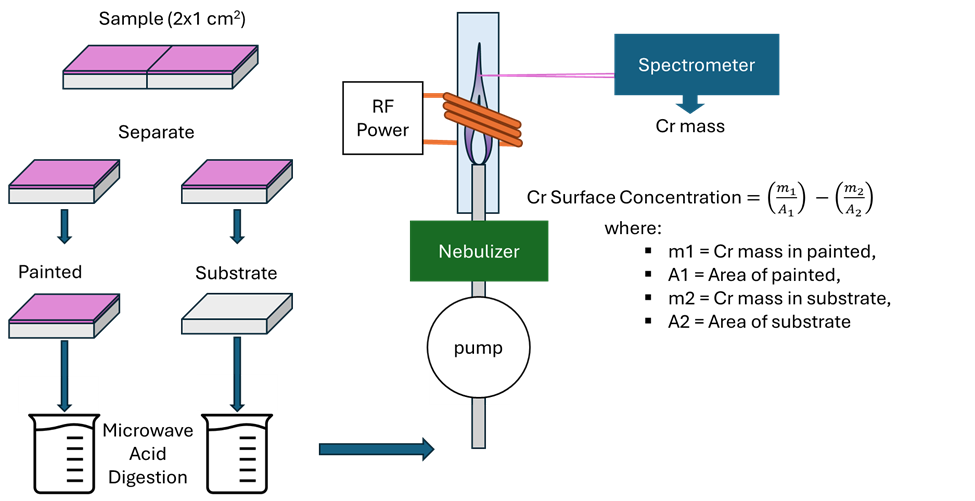
Bob proposed inductively coupled plasma optical emission spectroscopy (ICP-OES). Microwave acid digestion dissolves the sample completely, the liquid is sprayed into the plasma, and a spectrometer measures the chromium emission line. A calibration curve gives the amount of chromium, and dividing by the sample area gives the result Widget wanted.
A Widget engineer noted that the alloy itself could contain between 0.00% and 0.10% chromium. Alice had seen none in the substrate, but she would miss it below 0.1 wt%. Bob could measure down to parts per billion, and he proposed digesting the aluminum substrate near each sample too, so the chromium in the alloy could be subtracted from the result.
Sample preparation again received careful attention. The method trims a 2 cm2 piece of painted aluminum from a larger section and splits it into two subsamples. A razor scrapes the paint and primer from one subsample, and an acidic rinse removes the top layer of aluminum. A document scanner, calibrated with a NIST-traceable resolution chart, measures the area of each piece. After acid digestion of each half, ICP-OES measures the chromium in the substrate subsample and in the painted subsample, and the results are reported in µg/cm2.
A standard operating procedure followed. Widget’s engineers sorted their aluminum stock by surface treatment and tested samples from other aluminum companies to verify alternative suppliers. They also reached a settlement with the company that had supplied the poorly treated aluminum.
The moral of the story: different labs, different strengths
Plug-n-Chug labs are fast, efficient, and affordable. They suit routine analyses with established procedures, such as verifying that steel meets an ASTM specification or that a polymer has the correct molecular weight. Confirm that the lab holds the industry-specific certifications you need, and ask about sample preparation. In the story, Plug-n-Chug’s scientists should have asked more questions to avoid wasting time and money. Widget’s engineers helped by supplying both a control and a defective sample.
Problem-solving labs are research-oriented and work best when standard methods do not exist or fall short. They understand sample preparation, explain the methods they use, know their instruments and sources of uncertainty, and develop custom approaches. They sometimes ask an annoying number of questions. These labs matter when the problem is new or when initial results do not make sense.
If you make widgets and have questions, choose your lab to match the problem.
Choose an efficiency-focused lab when
- You need routine verification of known properties.
- Standard test methods exist for your analysis.
- The work is quality control rather than problem solving.
Choose a research-oriented lab when
- Standard methods have failed or given unexpected results.
- The problem is new or unusual.
- The stakes justify additional investment.
- You need method development rather than routine testing.
- You need more than a table of data for a report.